Realtime Response Under Load (RRUL) Specification
DRAFT: .07; Originally published 6 November 2012
AUTHOR: Dave Täht
This page is an HTML version of the original Word document at: https://github.com/dtaht/deBloat/tree/master/spec It has small formatting changes, but no editorial or grammatical changes to the original document.
The Flent network testing tool implements this specification.
Overview
The Realtime Response Under Load (RRUL) test puts a network under worst case conditions, and then measures for fairness, latency, realtime responsiveness, classification based optimization (and preservation), and the relative performance of TCP and UDP streams of varying rates, while under that load. Most importantly, it tests for web page load time performance while under these loads.
The test can use IPv6 (if available) and IPv4, producing a combined output of one main metric (web response time under load normalized against baseline web page response time) and a variety of additional useful statistics and factoids.
Rationale
Most network tests available today test a single problem in isolation. Whether it be bandwidth, response time, MOS score, packet loss, or traceroute/mtr, the existing tools and and products available to network engineers usually test for one problem at a time, only.
This is of course, not how we use our networks, and most networking problems – notably the side effects of bufferbloat - occur in combination with some sort of load.
Typical traffic contains a wide mix of uploads and download types. In addition to increasing amount of movie downloads, there is an increasing amount of realtime traffic, such as gaming, chat, voice, and videoconferencing. Web traffic in particular is very different than the kind of traffic measured by a pure bandwidth test – a web page load contains many short, sharded TCP streams, accompanied by many DNS lookups, and pages remain “active” for a long time, doing periodic refreshes of core interactive information. Web TCP streams rarely have sufficient duration to get out of slow start. Lastly, most web sites contain a large amount of javascript based downloads that are poorly emulated by existing tools.
A benchmark that quickly tests for the characteristics of a loaded network comprehensively, under these use cases, is needed.
Test Requirements
- MUST test ipv6 and ipv4 simultaneously if available
- MUST test for classification preservation and optimization
- MUST run long enough to defeat bursty bandwidth optimizations such as PowerBoost and discard data from that interval.
- MUST measure unloaded network performance of web pages, CIR and VOIP-like streams
- MUST measure network performance under a saturating background load, of web pages, CIR and VOIP-like streams
- MUST test UDP and TCP.
- MUST track and sum bi-directional throughput, using estimates for ACK sizes of ipv4, ipv6, and encapsulated ipv6 packets, udp and tcp_rr packets, etc.
- MUST have the test server(s) within 80ms of the testing client
- MUST track CPU loading as a factor in being able to drive the test at full speed or not. Insufficient CPU available should invalidate the tests.
- MUST run in userspace on the client(s)
- COULD require special kernel assistance (such as web100) on the servers
- SHOULD test for ECT(0) and ECT(1) ECN markings
- SHOULD test for classification preservation/alteration
Test Versioning
As typical workloads change over time (example: the typical web page has grown in size in a decade from under 100k to nearly a megabyte), there will be periodic revisions to the behavior of the backend tools and emulations. This first iteration shall be called RRUL2013.
Variables Under Test
- Aggregate (up,down and bidirectional) Bandwidth, including ACK overhead
- Up/Down Latency and Jitter of CIR, UDP, and TCP streams
- Up/Down Stream Delay
- Packet Loss on CIR, UDP, and TCP streams
- Stream Start Time Slew
- DNS Lookup Speed
- Short Flow Transfer Rate
- Classification Preservation and Optimization
Test Flow
Load Generation Component
To shorten the ramp-up-to-saturation period, multiple TCP streams will be used. The smallest number of streams required to fully test up/down bandwidth is 4 in each direction. It is anticipated that this will cause “interesting” behavior in networks running at speeds below 5Mbit, as a full size (1500 byte) packet takes 13ms to transmit at 1Mbit. The sum of bandwidth required for the other CIR tests and ACK returns is less than the overhead of a single TCP upstream, with the web component generating a presently unknown load in the downstream and upstream directions. The presence of multiple streams will partially defeat ack optimization techniques. Analysis of start time slew, relative interstream bandwidth on a 100ms period, vis a vis classification and underlying (ipv4,ipv6) protocol will be kept.
Web Component
Analyzing web site behavior under load is critical to this test. A typical web page consists of dozens of dns lookups and dozens of (usually short) TCP flows.
While under the sorts of loads envisioned by RRUL2013, a “typical” web page load will be executed multiple times, with one series without load, and another series, with load. The best analog for this benchmark is currently the chrome-benchmark. The core statistics from the chrome benchmark relevant to this test are the “commit load mean”, stddev, 95% CI (for the network only however) and the total load time samples.
This portion of the test will take your favorite website as a target and show you how much it will slow down, under load.
For a reference test, instead - an analysis of typical web behavior as of 2013 for the top 100 alexa web sites (notably interactive cloud based ones such as google, xfinity, amazon, and salesforce.com) would need to be performed so that their behavior can be appropriately simulated.
Realtime Component
The realtime component is intended to analyze the behavior of very sparse streams, such as those generated by DNS, DHCP, SSH, MOSH, remote management protocols (SNMP, RDP & X11), etc. A simple set of “fastest possible” UDP and TCP exchanges roughly equivalent to the netperf “RR” benchmarks will suffice, with reference to the unloaded RR times for presentation purposes. Timestamps should be transmitted and retained to measure delay and jitter on both an upstream and downstream basis.
VoIP Component
- UDP Streams marked with 3 diffserv classifications will be emitted on a 10ms interval in both directions.
- UDP packet size will be typical of a G.711 encoding
- Bidirectional delay statistics shall be collected and displayed
- Bidirectional packet loss statistics shall be collected and displayed
- JITTER in excess of 30ms shall be treated as packet loss.
Analysis Component
The equivalent of tcptraceroute or mtr shall be run continuously in both directions to identify the bottleneck source.
The RRUL Score
An optimum result would be: zero packet loss for the realtime and voip-like streams, jitter below 30ms for same, streams marked CS1 transmitting at 5% or less of available bandwidth (but not starved), streams marked EF at 30% or less (but not 95%!), and roughly equal sharing of bandwidth, jitter, and delay (accounting for ACK and MTU differences) between IPv4 and IPv6 streams of the same types.
How to turn this into a single “score” is a problem. The most effective number is the latency under load figure from chrome-benchmark derived from the baseline unloaded value, scaled to 100, and then shown relatively – Example would be a chrome-benchmark that completes in 20ms normally, but 139ms under load, which results in a value of 14.
Additionally, over the course of the test that score, jitter, delay, slew, & packet loss could presented in the form of a graphic equalizer-like display, across the different classification types and ipv6/ipv4 protocols.
A final score could be created by scaling each result vs the ideal relative to unloaded behavior, further scaling each variable on a scale of 0-20, and summing the result for a maximum value of 100.
However capturing bad behaviors is hard to “score”. Bad behaviors include bad slew (indicating SYN packet loss on new streams), EF traffic dominating hugely over all other traffic, CS1 traffic being treated equally with other traffic, TCP streams of different types not being roughly equal in bandwidth, huge upstream delays or down stream delays, etc. Perhaps a second, “penalty” score should be kept.
You’ll note that there is NO number envisioned for the presentation of “bandwidth”. There are plenty of tests for bandwidth already. What is under measure here is “responsiveness under load”, which is a metric of far more interest for anyone that clicks on anything and expects a result within a reasonable period. Bandwidth does need to be calculated in order to accurately measure saturation, however. RTT is necessary, also. Useful would be “actual data transferred under load”, rather than raw bandwidth, as this would account somewhat for tcp retransmits and other compensatory behavior for packet loss, which is usually invisible to a userspace application.
Alternative Test Methods
Test Methods ruled out
- UDP flooding – this method, while quickly filling queues, does not resemble typical traffic. It is perhaps useful to do in conjunction with these tests as to observe the effect of malware attempting to saturate the network.
- Ping and ping6 – ICMP is often de-prioritized or lost, first, under load. However the presence/absence of useful ICMP messages (such as ETOOBIG) would be good to track.
Possible Problems
- Some video streaming providers inject a burst of data into the network every 10 seconds instead of using normal TCP metrics to measure bandwidth over the course of a flow. The RRUL tests do not simulate that behavior.
- The tests proposed test the performance of TCP streams mostly. Short RTT times to the servers are required to ramp up to full bandwidth.
- The effect of bittorrent like flows (dozens or hundreds of low rate streams) is not analyzed.
- The behavior of VPN traffic is not analyzed.
Problems with Existing Tests
SPEEDTEST.NET Currently tests for ping response time, and up and download bandwidth, in isolation. It is unknown to what extent a flash based application can thread and execute these tests simultaneously. It also does not run long enough at higher bandwidths (e.g. 100Mbit) to generate a valid result.
ICSI netanalyzr While more comprehensive than other tests, the buffer measurement test is easily fooled by several factors, and as it is written in java, has low visibility into the network stack. Due to infrastructure issues, tests run in 2012 and prior have peaked at 20Mbit.
NETPERF While flexible, and robust, scripting around the command line based netperf leaves something to be desired. Modifying netperf to generate more (possibly all) of this test would allow for command line and gui based tools to be more easily layered on top of it.
IOS and ANDROID Both of these Oses provide limited visibility into the underlying network stack.
LINUX Linux, as of version 3.6, has made the most progress to date in eliminating sources of bufferbloat throughout the server/host stack – so much so as to invalidate all previous benchmarks.
WINDOWS - tbd
MACOSX - tbd
Appendix A (prototyping these tests)
The most flexible and trusted tool commonly available is netperf. Aside from the web and voip related tests described herein, netperf can be parsed (or extended) to yield most of the results required.
Each of the netperf results need to be captured and analyzed separately and in combination via a wrapper such as: https://github.com/tohojo/netperf-wrapper, however enhancing netperf and/or developing a new suite of tests suitable for wide deployment would be more accurate and useful.
Simplest Example
#!/bin/sh

SERV=snapon.lab.bufferbloat.net

netperf -l 70 -H $SERV -t TCP_RR &
sleep 5
netperf -l 60 -H $SERV -t TCP_STREAM &
netperf -l 60 -H $SERV -t TCP_MAERTS &

wait
This generates a single easily understood graph that can be used to eyeball delay under load. It can be combined with other tests to compare changes to the network/hardware configuration.
Examples of what can seen with this simplified test on an ethernet network are in:
https://raw.github.com/tohojo/netperf-wrapper/master/sample_plots/10m_pfifo_fast.png
vs
https://raw.github.com/tohojo/netperf-wrapper/master/sample_plots/10m_fq_codel.png
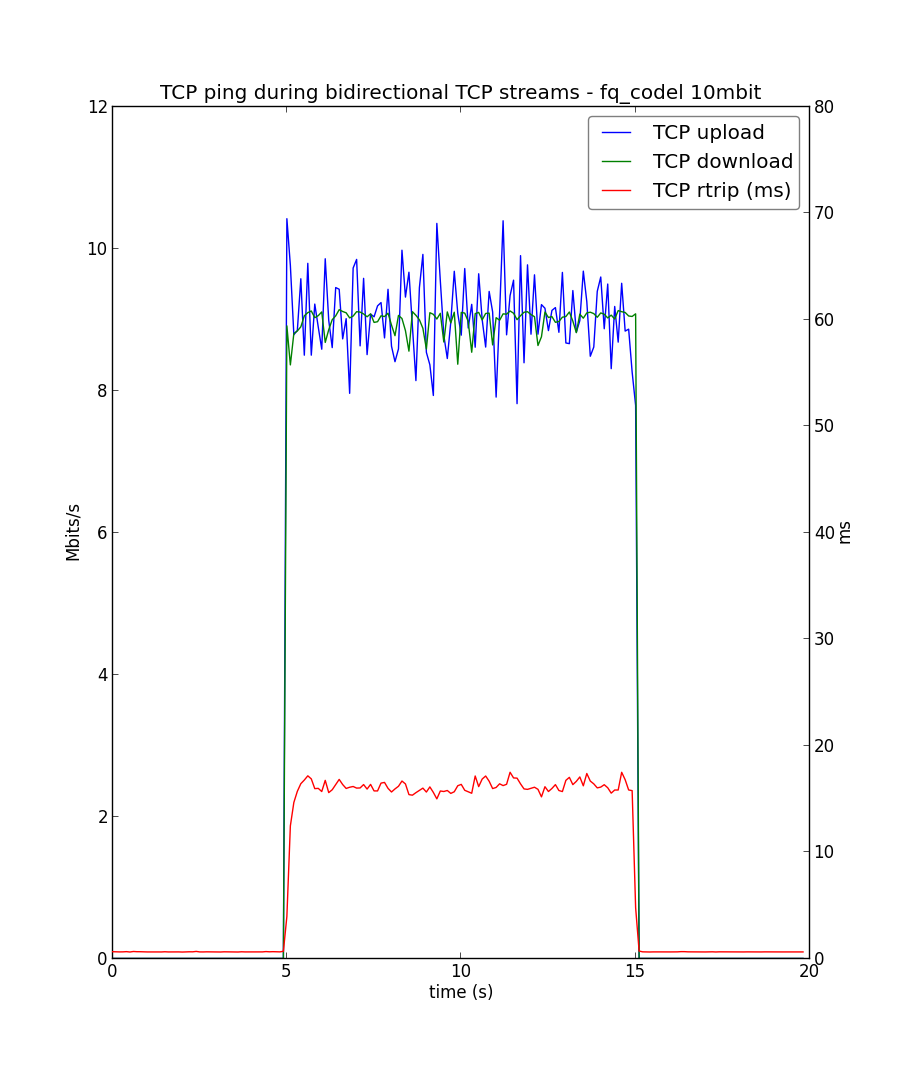
The first plot shows 76ms of delay under load, significant jitter, and some misbehavior during TCP slow start. The second, shows ~18ms delay under load, nearly no jitter, and a smooth slow start.
This test does not run fast enough or effectively enough on slower, longer RTT ISP networks, and something more extreme is needed. Certainly in this case, a chrome-benchmark could be run at the same time, to calculate web page loads, under this load.
More Complete Example
#!/bin/sh

SERV={snapon.lab.bufferbloat.net+$1}

ADDR6=`ip -6 addr show dev wlan1 | grep inet6 | awk '{ print $2}' | grep -v ^fe80:: | wc -l`

if [ $ADDR6 -gt 0 ]
then
  IPV6=-6
  echo “IPv6 is enabled”
else
  IPV6=-4
  echo “IPv6 is disabled”
fi

# Capturing the output of mtr would allow for diagnosis of the exact location of the bottleneck
#
mtr $SERV

netperf -Y CS1,CS1 -l 60 $IPV6 -H $SERV -t TCP_STREAM &
netperf -Y CS1,CS1 -l 60 $IPV6 -H $SERV -t TCP_MAERTS &
netperf -Y CS1,CS1 -l 60 -4 -H $SERV -t TCP_STREAM &
netperf -Y CS1,CS1 -l 60 -4 -H $SERV -t TCP_MAERTS &


sleep 1

# Test for slew
netperf -Y CS0,CS0 -l 59 $IPV6 -H $SERV -t TCP_STREAM &
netperf -Y CS0,CS0 -l 59 $IPV6 -H $SERV -t TCP_MAERTS &
netperf -Y CS0,CS0 -l 59 -4 -H $SERV -t TCP_STREAM &
netperf -Y CS0,CS0 -l 59 -4 -H $SERV -t TCP_MAERTS &

sleep 1

#These two tests are actually usually started before the load test and continue past the end,
# to create a bell curve.
# Test TCP RTT while under load
netperf -Y EF,EF -l30 -H $SERV -t TCP_RR > $SERV.EF.TCP_RR &
netperf -Y CS1,CS1 -l30 -H $SERV -t TCP_RR > $SERV.CS1.TCP_RR &
netperf -Y CS0,CS0 -l30 -H $SERV -t TCP_RR > $SERV.CS0.TCP_RR &

# Test UDP RTT while under load

# the UDP size should be set to the size for a typical VOIP packet (280 bytes max)
netperf -Y EF,EF -l25 -H $SERV -t UDP_RR > $SERV.EF.UDP_RR &
netperf -Y CS1,CS1 -l25 -H $SERV -t UDP_RR $SERV.CS1.UDP_RR &
netperf -Y CS0,CS0 -l25 -H $SERV -t UDP_RR $SERV.CS0.UDP_RR &


# A voip-like test
fping -i10 -b280 -c 5000 $SERV > $SERV.ping

# Most websites now contain a large amount of javascript and
# the best test for website performance is currently the interactive
# chrome benchmark test. Wget does not do a useful measurement on google.com, as one example.
#time wget -m –level 1 http://some_website
#time wget -m –level 1 http://some_website

wait
Flaws in the full example
- There is not an explicit voip test above. The ping is a poor substitute.
- Summing the actual bandwidth used by the various tests would make it possible to normalize the score better.
- There is a test version of a netperf-wrapper script for most of the above tests available as “rrul.ini” from the netperf-wrapper source-code site.
More test design options:
UDP Flooding as a load generator Alternative test scripts that use UDP flooding can be used. However these will blow up AQM algorithms such as tail drop and codel thoroughly. FQ_codel would be resistant.
Alternative TCP Stacks Implement a complete TCP stack in the application, so that packet loss, CWND reduction, window fiddling, etc, can be monitored and graphed.
Comments On This Specification
Rick Jones (author of netperf):
1) Why a MUST for v4 and v6 simultaneously? A) Should try to catch ipv6 problems in the bud. These include mishandling classification, ecn, and shaping issues. B) Scoring the lack of ipv6 connectivity as a separate negative helps adoption. C) Running the same number of streams with ipv4 only available normalizes the results somewhat for comparison to dual stacked tests.
2) For that matter is there any indication that issues of bloat differ between the use of IPv4 and IPV6?
A) No known linux shaper besides Cerowrt’s shapes ipv6 native or encapsulated correctly. The presence of ipv6 blows up ipv4, under load. B) Many devices and networks do ipv4 in the fast path(hardware), and IPv6 in the slow path (cpu), and this may also cause problems.
3) The MUST for being able to account for ACKs is going to make your multiple OS requirement more difficult. Considerably. One could I suppose account for UDP and presumed IP header sizes in a UDP test, but accounting for them in TCP means knowing how TCP actually segmented the data stream. None of that is portable unless perhaps we define portable as “post processing of a presumed to be complete packet trace.”
A) Agreed. However some estimate of acks should be provided as they will constitute a substantial percentage of the bandwidth used by the streams. The alternative is developing a complete TCP stack in userspace… or instrumenting kernels with web100.
4) You’ve ruled-out using UDP flooding because it is not typical, but will use multiple TCP streams to get things loaded quickly. Unless the number of simultaneous TCP streams you use happens to coincide with typical, I see that as an inconsistency.
A) Multiple TCP streams occur more often than UDP floods. Also, most existing tests use UDP flooding. 8 TCP streams is a lot more than what I would consider typical, too. However, it does ramp up quickly, defeats most forms of ack compression, and simultaneously (as per the netperf script) lets different forms of ip and classification be tested for, against each other.
I have had great difficulty getting one stream to saturate a cable or WIFI network over longer RTTs than what jg experiences on his link to MIT. I have had success in under 40 seconds going 170ms RTT to the target server.
Jim Gettys
1) I’m very worried about this being neither fish nor fowl: not a really simple test you can get your head around, nor a realistic benchmark of today’s web behavior. Both are needed; the second is exquisitely difficult to define and a moving target (particularly with IW10 + Spdy in the mix).
A) The need to define a web simulation in the test is a major weakness of this document, which is why the handwave in italics is there for it. However the characteristics of web traffic - to date - NOBODY – emulates. The responsiveness of web traffic, from click to result, under load, is the real problem we are testing for - and it’s stupid to extrapolate from (as cisco did) 150 full rate streams - or even single stream behavior - when there are dozens or hundreds of dns lookups and short tcp streams involved in accessing a single web page. I suggest a separate, ongoing effort, to develop this portion of the test, and in the interim, measure the scores via before/during comparisons on existing web sites.
I’m not convinced that running more TCP streams fills buffers faster, at least in a simple way. Buffers fill at a rate of one packet/ack; but as you have more flows, each stream’s acks get spread out correspondingly, so I don’t see the buffers filling faster in general.
A) This is not the behavior on entering slow start. B) I gave an example of a simpler test in the “simple example” section, that tests for the standard subset of one TCP up, one down, and then single stream latency. It’s our standard test. In using that on longer RTTs, the simpler test fails to work often enough for me to suggest these more extreme tests. Preliminary testing of the core ideas from RTTs as distant as 170ms seem to work.
At best, what each stream does is roughly what netalyzr does (initially) during slow start; as it’s doubling the number of packets each time until loss is discovered. But then (after probably multiple losses), you get the one/ack refill behavior. And as the acks get further and further delayed, the fill gets slower and slower. And on really badly buffered links (e.g. my brother’s DSL connection with 6 seconds of buffering), that’s going to be one hell of a long time.
A) More prototyping, and experimentation at scale, is required before this specification is finalized.
Do you expect this test to run on WinXP?
A) Not unless someone writes a version that will work on it. B) Windows XP has the TCP window scaling limitation that forces multiple connections in the first place. Many providers are fiddling with TCP scaling as a means to control bandwidth over-usage on their networks, and a coherent way to look at that – from userspace – would be needed in order to analyze the effects. On specially modified servers, this seems feasible. On clients, unlikely.
Bloat Project
Recent Updates
Find us elsewhere
#bufferbloat on Twitter
Google+ group
Archived Bufferbloat pages from the Wayback Machine
Sponsors
Comcast Research Innovation FundNlnet Foundation
Shuttleworth Foundation
GoFundMe
Bufferbloat Related Projects
OpenWrt ProjectCongestion Control Blog
Flent Network Test Suite
Sqm-Scripts
The Cake shaper
AQMs in BSD
IETF AQM WG
CeroWrt (where it all started)
Network Performance Related Resources
Jim Gettys' Blog - The chairman of the Fjord
Toke's Blog - Karlstad University's work on bloat
Voip Users Conference - Weekly Videoconference mostly about voip
Candelatech - A wifi testing company that "gets it".