Bug #262
poor wireless performance in smoketest rc6
Description
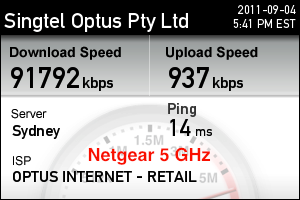
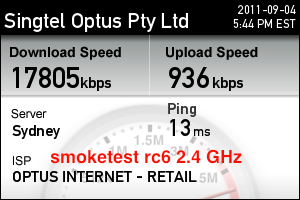
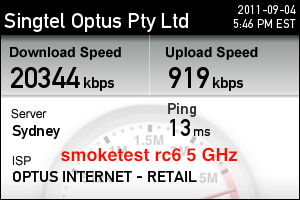
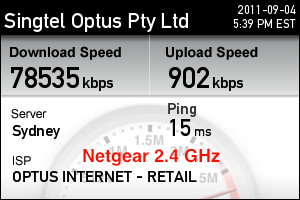
Side by side comparison of Netgear and Cerowrt firmware shows that Cerowrt has significantly worse performance.91Mbps Netgear 5 GHz
78Mbps Netgear 2.4 GHz
20Mbps Smoketest rc6 5 GHz
17Mbps Smoketest rc6 2.4 GHz
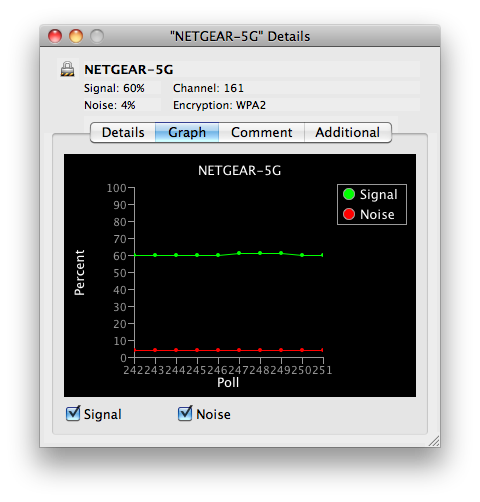
Images attached show signal levels and the output from the Optus Sydney speedtester which is quite local to my home network. The WiFi signal levels are comparable for both routers, so I don’t think this is an RF issue. There are some other APs in my area in the 2.4GHz band, but their levels are relatively low.
Notes:
- 2 x WNDR7200v2 boxes
- Netgear fw: 1.0.0.8
- Mac OSX 10.6.8, Macbook Pro laptop
- 3 feet between access points
- 4 feet to the laptop which was more or less equidistant to the APs
Attachments
History
Can you repeat test with a wired connection to isolate the wireless out of the equation?
The box running Cerowrt is connected to the cable modem.
The box running Netgear firmware is connected to the Cerowrt box with an
Ethernet cable.
This makes it convenient to do side-by-side tests and to compare
wireless signal leves (I wrestled for some time with regulartory
configuration to make the power levels the same).
Wireless Netgear performance measurement went through this chain:
- MacBook Pro
- Wndr3700v2/NetgearFW
- Wndr3700v2/Cerowrt-rc6
- Cisco DPq3213
- off-to-Speedtester
If there were something bad with the Cerowrt Ethernet forwarding performance, it should have affected the Netgear wireless performance result.
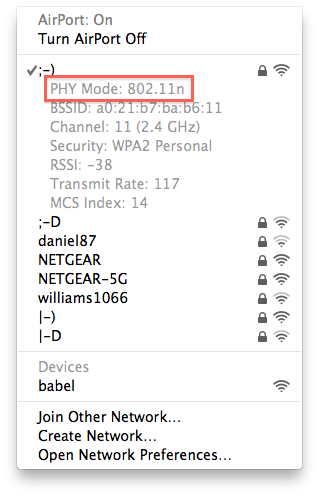
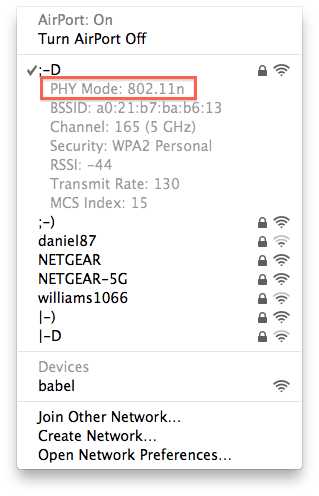
Re negotiating wireless-n - can you suggest a way of identifying what mode is being used?
MacOSX reports “PHY Mode: 802.11n” for both 2.4GHz and 5GHz.
See attached screen captures..
On 6/09/2011, at 9:21 PM, cerowrt@lists.bufferbloat.net wrote:
Issue #262 has been updated by Dave Täht.
(I’m not complaining, it’s just that the number of people willing to risk their networks on beta-quality code astounds (and pleases) me)
—————————————-
Bug #262: poor wireless performance in smoketest rc6
https://www.bufferbloat.net/issues/262
Author: Aidan Williams
Status: New
Priority: Normal
Assignee:
Category:
Target version:
Side by side comparison of Netgear and Cerowrt firmware shows that Cerowrt has significantly worse performance.
91Mbps Netgear 5 GHz
78Mbps Netgear 2.4 GHz
20Mbps Smoketest rc6 5 GHz
17Mbps Smoketest rc6 2.4 GHz
Images attached show signal levels and the output from the Optus Sydney speedtester which is quite local to my home network. The WiFi signal levels are comparable for both routers, so I don’t think this is an RF issue. There are some other APs in my area in the 2.4GHz band, but their levels are relatively low.
Notes:
* 2 x WNDR7200v2 boxes
* Netgear fw: 1.0.0.8
* Mac OSX 10.6.8, Macbook Pro laptop
* 3 feet between access points
* 4 feet to the laptop which was more or less equidistant to the APs
But maybe that’s splitting hairs. In this example, there is a factor of 4 difference in performance. Would wireless variation/fading/multipath account for a 4x reduction in performance?
The slow speed on Cerowrt appears to happen wherever I am in the room. I move the laptop around…
I see no other 5GHz devices (other than the Cerowrt and Netgear boxes) when I scan.
That said, a good repeat would be to swap firmware holding the distances the same, or swap devices holding the distances the same.
wlan0     IEEE 802.11abgn  ESSID:"jupiter5"
          Mode:Managed  Frequency:5.805 GHz  Access Point: A0:21:B7:A9:86:7C
          Bit Rate=130 Mb/s   Tx-Power=16 dBm
          Retry  long limit:7   RTS thr:off   Fragment thr:off
          Power Management:off
          Link Quality=63/70  Signal level=-47 dBm
          Rx invalid nwid:0  Rx invalid crypt:0  Rx invalid frag:0
          Tx excessive retries:470038  Invalid misc:7832   Missed beacon:0
I get ~20Mbit down, ~30Mbit up using a speedtest.net server in san jose (6ms path). using one in SF (3ms) ~21Mbit down, 41Mbit up.
Laptop is ubuntu 11.4, hardware is an intel lagn, wpa encryption is turned on, distance is about 4 meters, 5ghz.
ping times jump about 35ms.
Dave, a few millimeters can be significant… but if you get consistency moving around, I’d say it’s a real phenomenon.
At Indranet, we had a test path we used where a 50 mm move at one end would change the 11g performance from 21 Mbps to less than 1 Mbps. Great for testing Minstrel responsiveness, but not so great for testing other parts of the MAC… so I wanted to make sure Aidan wasn’t testing in that kind of situation. Seems he isn’t, which is good for the test (but not so good for rc6)
On 6/09/2011, at 9:54 PM, cerowrt@lists.bufferbloat.net wrote:
Issue #262 has been updated by Aidan Williams.
I just wandered around the room and into an adjacent room and ran the speed tester 5 times. They were all 18-21Mbps. This is quite consistent for me.
—————————————-
Bug #262: poor wireless performance in smoketest rc6
https://www.bufferbloat.net/issues/262
Author: Aidan Williams
Status: New
Priority: Normal
Assignee:
Category:
Target version:
Side by side comparison of Netgear and Cerowrt firmware shows that Cerowrt has significantly worse performance.
91Mbps Netgear 5 GHz
78Mbps Netgear 2.4 GHz
20Mbps Smoketest rc6 5 GHz
17Mbps Smoketest rc6 2.4 GHz
Images attached show signal levels and the output from the Optus Sydney speedtester which is quite local to my home network. The WiFi signal levels are comparable for both routers, so I don’t think this is an RF issue. There are some other APs in my area in the 2.4GHz band, but their levels are relatively low.
Notes:
* 2 x WNDR7200v2 boxes
* Netgear fw: 1.0.0.8
* Mac OSX 10.6.8, Macbook Pro laptop
* 3 feet between access points
* 4 feet to the laptop which was more or less equidistant to the APs
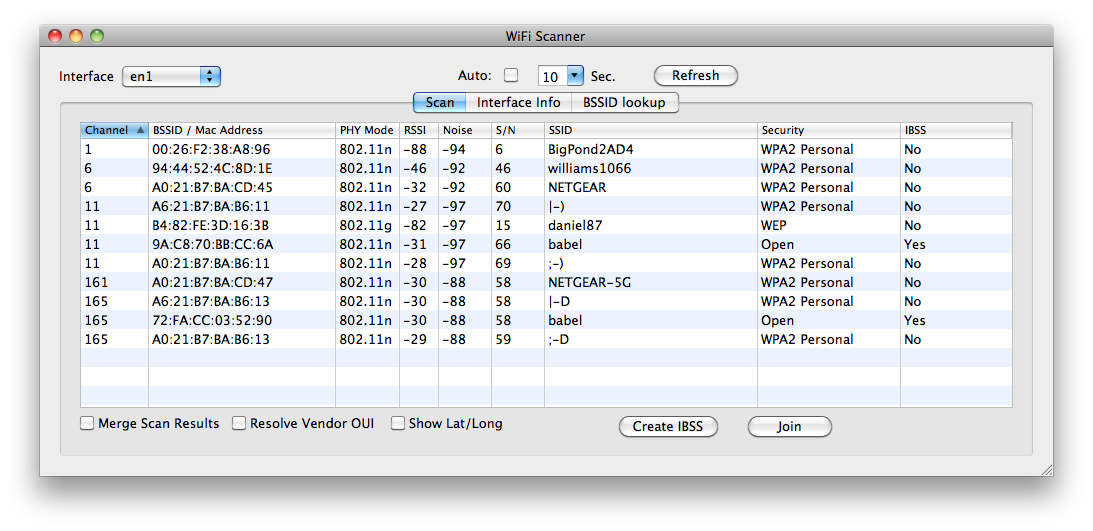
> are they on the same channels?
Channels look like this:
> are they on the same channels?
Channels look like this:

(Sorry about the repost - still getting the hang of this issue trackers markup language)
I got about 20Mbps (G). I got around 50Mbps (N), using my ath9k based
Dell Laptop.
It reported 130Mbps (iwconfig).
I noted the channel width was set to 20; I tried setting it to 40, but had trouble and threw in the towel (getting on an airplane with my family having a broken router would not be good for domestic tranquility.
Test: On the laptop performing the test, run tcpdump -i the_interface -wtest.cap
Call up test.cap in wireshark and look at the diffserv markings. if non-zero (ECN is ok), then we have half our traffic marked one way and return traffic marked another.
put test.cap somewhere I can look at it, please, not in the bug, they tend to be large.
Anyway, captured this speedtest run:
- 16287kbps down / 948kbps up
- speedtester-802.11n-5GHz-cerorc6smoke.png
Some files:
The modem was power cycled before doing all this.
5 runs of the speed tester were carried out before catting the ath9k
xmit file above.
MacOSX 10.6.8, 5GHz, 802.11n (as reported previously).
pinging from the ap:
1315688855 44:a7:cf:bf:33:21 172.29.7.81 * 01:44:a7:cf:bf:33:21
1315688696 00:26:bb:03:ac:b3 172.29.7.173 bjlee-macbook-pro
01:00:26:bb:03:ac:b3
1315679368 00:1f:3b:2d:df:f5 172.29.7.123 cruithne *
4 bytes from 172.29.7.81: seq=0 ttl=64 time=14.191 ms
64 bytes from 172.29.7.81: seq=1 ttl=64 time=697.771 ms
64 bytes from 172.29.7.81: seq=2 ttl=64 time=170.491 ms
64 bytes from 172.29.7.81: seq=3 ttl=64 time=198.249 ms
64 bytes from 172.29.7.81: seq=4 ttl=64 time=143.031 ms
64 bytes from 172.29.7.81: seq=5 ttl=64 time=3.928 ms
64 bytes from 172.29.7.81: seq=6 ttl=64 time=976.788 ms
64 bytes from 172.29.7.81: seq=7 ttl=64 time=1.751 ms
PING 172.29.7.173 (172.29.7.173): 56 data bytes
64 bytes from 172.29.7.173: seq=0 ttl=64 time=114.859 ms
64 bytes from 172.29.7.173: seq=1 ttl=64 time=136.401 ms
64 bytes from 172.29.7.173: seq=2 ttl=64 time=160.695 ms
64 bytes from 172.29.7.173: seq=3 ttl=64 time=184.795 ms
64 bytes from 172.29.7.173: seq=4 ttl=64 time=208.588 ms
64 bytes from 172.29.7.173: seq=5 ttl=64 time=27.343 ms
And my ubuntu laptop:
root@jg1:/etc# ping 172.29.7.123
PING 172.29.7.123 (172.29.7.123): 56 data bytes
64 bytes from 172.29.7.123: seq=0 ttl=64 time=2.057 ms
64 bytes from 172.29.7.123: seq=1 ttl=64 time=0.797 ms
64 bytes from 172.29.7.123: seq=2 ttl=64 time=0.815 ms
64 bytes from 172.29.7.123: seq=3 ttl=64 time=0.936 ms
64 bytes from 172.29.7.123: seq=4 ttl=64 time=0.855 ms
64 bytes from 172.29.7.123: seq=5 ttl=64 time=0.840 ms
64 bytes from 172.29.7.123: seq=6 ttl=64 time=0.827 ms
\^C
> I am experimenting on some conference attendies. We may have a major problem interacting with macbook pros - perhaps in power save mode?
Quite possibly not just MB *Pro*s, and buggy earlier than rc6. These
are from my AP running cerowrt downloaded on 14 August showing “OpenWrt
Firmware Attitude Adjustment (r27959) LuCI Trunk 0.10+svn” (rc5, IIRC)
pinging to both a MB pro and an older (white) MB, both running OSX Lion:
First the MB Pro:
root@Lirpo5:~# ping 172.30.42.99
PING 172.30.42.99 (172.30.42.99): 56 data bytes
64 bytes from 172.30.42.99: seq=0 ttl=64 time=1.428 ms
64 bytes from 172.30.42.99: seq=1 ttl=64 time=35.166 ms
64 bytes from 172.30.42.99: seq=2 ttl=64 time=59.223 ms
64 bytes from 172.30.42.99: seq=3 ttl=64 time=83.757 ms
64 bytes from 172.30.42.99: seq=4 ttl=64 time=106.906 ms
64 bytes from 172.30.42.99: seq=5 ttl=64 time=130.749 ms
64 bytes from 172.30.42.99: seq=6 ttl=64 time=154.568 ms
64 bytes from 172.30.42.99: seq=7 ttl=64 time=178.428 ms
64 bytes from 172.30.42.99: seq=8 ttl=64 time=93.308 ms
64 bytes from 172.30.42.99: seq=9 ttl=64 time=1.304 ms
64 bytes from 172.30.42.99: seq=10 ttl=64 time=45.054 ms
64 bytes from 172.30.42.99: seq=11 ttl=64 time=68.897 ms
64 bytes from 172.30.42.99: seq=12 ttl=64 time=92.805 ms
64 bytes from 172.30.42.99: seq=13 ttl=64 time=116.048 ms
64 bytes from 172.30.42.99: seq=14 ttl=64 time=1.351 ms
\^C
— 172.30.42.99 ping statistics —
15 packets transmitted, 15 packets received, 0% packet loss
round-trip min/avg/max = 1.304⁄77.932⁄178.428 ms
Next the Older MB:
root@Lirpo5:~# ping 172.30.42.119
PING 172.30.42.119 (172.30.42.119): 56 data bytes
64 bytes from 172.30.42.119: seq=0 ttl=64 time=108.159 ms
64 bytes from 172.30.42.119: seq=1 ttl=64 time=29.406 ms
64 bytes from 172.30.42.119: seq=2 ttl=64 time=52.802 ms
64 bytes from 172.30.42.119: seq=3 ttl=64 time=77.018 ms
64 bytes from 172.30.42.119: seq=4 ttl=64 time=1.087 ms
64 bytes from 172.30.42.119: seq=5 ttl=64 time=22.297 ms
64 bytes from 172.30.42.119: seq=6 ttl=64 time=3.554 ms
64 bytes from 172.30.42.119: seq=7 ttl=64 time=69.114 ms
64 bytes from 172.30.42.119: seq=8 ttl=64 time=3.475 ms
64 bytes from 172.30.42.119: seq=9 ttl=64 time=15.583 ms
64 bytes from 172.30.42.119: seq=10 ttl=64 time=39.288 ms
64 bytes from 172.30.42.119: seq=11 ttl=64 time=64.266 ms
\^C
— 172.30.42.119 ping statistics —
12 packets transmitted, 12 packets received, 0% packet loss
round-trip min/avg/max = 1.087/40.504⁄108.159 ms
Both are on 802.11a, neither showing an N connection, and AFAICT with no other radios on the 802.11a band.
I’ll reflash the AP to smoketest rc6, just to eliminate another possible variable, and will report results back shortly…
Here are the new ping results:
Once again, first the MB Pro:
root@Lirpo5:~# ping 172.30.42.99
PING 172.30.42.99 (172.30.42.99): 56 data bytes
64 bytes from 172.30.42.99: seq=0 ttl=64 time=0.904 ms
64 bytes from 172.30.42.99: seq=1 ttl=64 time=56.728 ms
64 bytes from 172.30.42.99: seq=2 ttl=64 time=80.610 ms
64 bytes from 172.30.42.99: seq=3 ttl=64 time=104.474 ms
64 bytes from 172.30.42.99: seq=4 ttl=64 time=128.342 ms
64 bytes from 172.30.42.99: seq=5 ttl=64 time=1.227 ms
64 bytes from 172.30.42.99: seq=6 ttl=64 time=175.910 ms
64 bytes from 172.30.42.99: seq=7 ttl=64 time=199.757 ms
64 bytes from 172.30.42.99: seq=8 ttl=64 time=18.674 ms
64 bytes from 172.30.42.99: seq=9 ttl=64 time=42.665 ms
\^C
— 172.30.42.99 ping statistics —
10 packets transmitted, 10 packets received, 0% packet loss
round-trip min/avg/max = 0.904⁄80.929⁄199.757 ms
And next the old MB:
root@Lirpo5:~# ping 172.30.42.119
PING 172.30.42.119 (172.30.42.119): 56 data bytes
64 bytes from 172.30.42.119: seq=0 ttl=64 time=774.372 ms
64 bytes from 172.30.42.119: seq=1 ttl=64 time=2006.759 ms
64 bytes from 172.30.42.119: seq=2 ttl=64 time=1007.038 ms
64 bytes from 172.30.42.119: seq=3 ttl=64 time=7.137 ms
64 bytes from 172.30.42.119: seq=4 ttl=64 time=1214.317 ms
64 bytes from 172.30.42.119: seq=5 ttl=64 time=214.878 ms
64 bytes from 172.30.42.119: seq=6 ttl=64 time=8126.826 ms
64 bytes from 172.30.42.119: seq=7 ttl=64 time=7127.321 ms
64 bytes from 172.30.42.119: seq=8 ttl=64 time=6127.669 ms
64 bytes from 172.30.42.119: seq=9 ttl=64 time=5127.940 ms
64 bytes from 172.30.42.119: seq=10 ttl=64 time=4129.217 ms
64 bytes from 172.30.42.119: seq=11 ttl=64 time=3129.640 ms
64 bytes from 172.30.42.119: seq=12 ttl=64 time=2130.632 ms
64 bytes from 172.30.42.119: seq=13 ttl=64 time=1131.306 ms
64 bytes from 172.30.42.119: seq=14 ttl=64 time=131.394 ms
\^C
— 172.30.42.119 ping statistics —
17 packets transmitted, 15 packets received, 11% packet loss
round-trip min/avg/max = 7.137⁄2825.763⁄8126.826 ms
Note that the MB had just associated, and was likely still speed hunting.
FWIW, and hope this helps.
I’m ready and willing to perform some more tests, but will need some guidance as to what would be most helpful to the gurus…
There were several changes in the default /etc/ files that were changed for rc6, so if you reflashed and did not erase our old config, you may have re-introduced a problem that we moved towards fixing in the kernel (see bug #216)
txqueuelen for the wireless devices was made 37 in /etc/hotplug.d/iface/00-debloat and in /etc/config/network, and we have data indicating that it could be at least 3 times that, at present, under at least some workloads.
I’ve reflashed to the latest rc6-smoketest6 (new since my last flash a few hours back) and this time blew away the old config and re-configured from scratch.
Results – a similar scatter in pings to the MB Pro.
root@Lirpo5:~# ping 172.30.42.67
PING 172.30.42.67 (172.30.42.67): 56 data bytes
64 bytes from 172.30.42.67: seq=0 ttl=64 time=5.042 ms
64 bytes from 172.30.42.67: seq=1 ttl=64 time=98.623 ms
64 bytes from 172.30.42.67: seq=2 ttl=64 time=122.991 ms
64 bytes from 172.30.42.67: seq=3 ttl=64 time=1.346 ms
64 bytes from 172.30.42.67: seq=4 ttl=64 time=170.512 ms
64 bytes from 172.30.42.67: seq=5 ttl=64 time=194.345 ms
64 bytes from 172.30.42.67: seq=6 ttl=64 time=13.385 ms
64 bytes from 172.30.42.67: seq=7 ttl=64 time=37.313 ms
64 bytes from 172.30.42.67: seq=8 ttl=64 time=1.393 ms
64 bytes from 172.30.42.67: seq=9 ttl=64 time=84.963 ms
\^C
— 172.30.42.67 ping statistics —
10 packets transmitted, 10 packets received, 0% packet loss
round-trip min/avg/max = 1.346⁄72.991⁄194.345 ms
This is on an 802.11g (sw00) channel, since there seems to be an issue with DNS on the .11a (sw10) channel. Interestingly enough, when I associate with the .11a guest (sw11) channel, the DNS works. (Go figure; would you like me to file a bug report on that?)
Similarly, on my old MB:
root@Lirpo5:~# ping 172.30.42.87
PING 172.30.42.87 (172.30.42.87): 56 data bytes
64 bytes from 172.30.42.87: seq=0 ttl=64 time=1955.677 ms
64 bytes from 172.30.42.87: seq=1 ttl=64 time=955.671 ms
64 bytes from 172.30.42.87: seq=2 ttl=64 time=0.937 ms
64 bytes from 172.30.42.87: seq=3 ttl=64 time=0.978 ms
64 bytes from 172.30.42.87: seq=4 ttl=64 time=44.255 ms
64 bytes from 172.30.42.87: seq=5 ttl=64 time=68.310 ms
64 bytes from 172.30.42.87: seq=6 ttl=64 time=91.991 ms
64 bytes from 172.30.42.87: seq=7 ttl=64 time=13.431 ms
64 bytes from 172.30.42.87: seq=8 ttl=64 time=36.923 ms
64 bytes from 172.30.42.87: seq=9 ttl=64 time=61.483 ms
64 bytes from 172.30.42.87: seq=10 ttl=64 time=84.531 ms
\^C
— 172.30.42.87 ping statistics —
12 packets transmitted, 11 packets received, 8% packet loss
round-trip min/avg/max = 0.937⁄301.289⁄1955.677 ms
Next steps?
until I acquire more OSX gear like yours the best I can do is add more eyeballs to the bug, which I just did.
It really looks as though minstrel is getting confused by the wireless algo in osx, or vice versa.
The best suggestion I’ve had is from luis, who suggests trying the atheros algorithm instead of minstrel, which I’ll do a build of monday-ish.
in the meantime if you could capture some of the rate statistics as suggest by felix earlier in the bug - and also run some traffic through it before starting your tests - that may help.
It would also cheer me up if you’d report back elsewhere on what IS working well.
root@OpenWrt:~# ping 192.168.1.194
PING 192.168.1.194 (192.168.1.194): 56 data bytes
64 bytes from 192.168.1.194: seq=0 ttl=64 time=1.226 ms
64 bytes from 192.168.1.194: seq=1 ttl=64 time=87.782 ms
64 bytes from 192.168.1.194: seq=2 ttl=64 time=110.224 ms
64 bytes from 192.168.1.194: seq=3 ttl=64 time=0.996 ms
64 bytes from 192.168.1.194: seq=4 ttl=64 time=157.715 ms
64 bytes from 192.168.1.194: seq=5 ttl=64 time=180.557 ms
64 bytes from 192.168.1.194: seq=6 ttl=64 time=205.907 ms
64 bytes from 192.168.1.194: seq=7 ttl=64 time=22.846 ms
64 bytes from 192.168.1.194: seq=8 ttl=64 time=46.363 ms
64 bytes from 192.168.1.194: seq=9 ttl=64 time=1.137 ms
64 bytes from 192.168.1.194: seq=10 ttl=64 time=1.108 ms
64 bytes from 192.168.1.194: seq=11 ttl=64 time=1.061 ms
\^C
— 192.168.1.194 ping statistics —
12 packets transmitted, 12 packets received, 0% packet loss
round-trip min/avg/max = 0.996⁄68.076/205.907 ms
But using UDP to generate port-unreachables:
root@OpenWrt:~# traceroute -q 40 192.168.1.194
traceroute to 192.168.1.194 (192.168.1.194), 30 hops max, 38 byte
packets
1 andrewm-lo.lan (192.168.1.194) 2.377 ms 0.970 ms 1.239 ms 1.286 ms
1.714 ms 1.615 ms 1.015 ms 1.360 ms 1.058 ms 1.287 ms 1.658 ms 1.638 ms
0.902 ms 1.118 ms 1.941 ms 1.005 ms 2.006 ms 0.874 ms 1.022 ms 1.595 ms
1.249 ms 1.086 ms 1.207 ms 1.227 ms 2.780 ms 1.817 ms 1.680 ms 1.221 ms
1.246 ms 1.291 ms 1.247 ms 1.430 ms 3.137 ms 0.930 ms 1.280 ms 1.610 ms
1.757 ms 0.967 ms 1.028 ms 1.232 ms
root@OpenWrt:~# traceroute -q 40 192.168.1.194
traceroute to 192.168.1.194 (192.168.1.194), 30 hops max, 38 byte
packets
1 andrewm-lo.lan (192.168.1.194) 1.515 ms 1.056 ms 1.675 ms 0.953 ms
0.935 ms 1.318 ms 1.005 ms 1.055 ms 0.945 ms 0.929 ms 0.925 ms 0.934 ms
1.775 ms 1.650 ms 1.015 ms 0.945 ms 0.940 ms 0.991 ms 0.995 ms 1.323 ms
0.963 ms 0.922 ms 1.675 ms 0.992 ms 1.180 ms 0.957 ms 0.917 ms 0.937 ms
1.142 ms 1.136 ms 1.129 ms 2.238 ms 1.913 ms 0.935 ms 0.894 ms 1.948 ms
0.915 ms 1.273 ms 2.085 ms 0.936 ms
root@OpenWrt:~# traceroute -q 40 192.168.1.194
traceroute to 192.168.1.194 (192.168.1.194), 30 hops max, 38 byte
packets
1 andrewm-lo.lan (192.168.1.194) 1.788 ms 1.014 ms 1.134 ms 1.563 ms
1.019 ms 0.924 ms 0.964 ms 1.024 ms 2.345 ms 1.317 ms 1.263 ms 0.967 ms
1.354 ms 1.716 ms 1.308 ms 1.407 ms 1.346 ms 1.191 ms 0.976 ms 0.928 ms
0.921 ms 1.411 ms 1.148 ms 1.662 ms 1.129 ms 1.144 ms 1.646 ms 1.269 ms
1.294 ms 1.356 ms 1.256 ms 2.389 ms 1.294 ms 1.275 ms 1.277 ms 0.972 ms
1.326 ms 0.991 ms 1.013 ms 0.929 ms
And TCP, single connection lots of requests (obviously running a netserver on my Mac):
root@OpenWrt:~# netperf t TCP_RR 192.168.1.194 - -r64,64
MIGRATED TCP REQUEST/RESPONSE TEST from 0.0.0.0 (0.0.0.0) port 0
AF_INET to localhost (127.0.0.1) port 0 AF_INET : first burst 0
Local /Remote
Socket Size Request Resp. Elapsed Trans.
Send Recv Size Size Time Rate
bytes Bytes bytes bytes secs. per sec
16384 87380 64 64 10.00 7208.01
16384 87380
TCP again, this time moving 64 bytes per connection:
root@OpenWrt:~# netperf t TCP_CRR 192.168.1.194 - -r64,64
MIGRATED TCP Connect/Request/Response TEST from 0.0.0.0 (0.0.0.0) port 0
AF_INET to localhost (127.0.0.1) port 0 AF_INET
Local /Remote
Socket Size Request Resp. Elapsed Trans.
Send Recv Size Size Time Rate
bytes Bytes bytes bytes secs. per sec
16384 87380 64 64 10.00 1067.20
16384 87380
That pretty conclusively shows that it’s ICMP ping that is at fault here, not the network.
Andrew
On 11/09/2011, at 12:16 AM, cerowrt@lists.bufferbloat.net wrote:
Issue #262 has been updated by Frank Horowitz.
Thanks for the response, Dave.
I’ve reflashed to the latest rc6-smoketest6 (new since my last flash a few hours back) and this time blew away the old config and re-configured from scratch.
Results – a similar scatter in pings to the MB Pro.
root@Lirpo5:~# ping 172.30.42.67
PING 172.30.42.67 (172.30.42.67): 56 data bytes
64 bytes from 172.30.42.67: seq=0 ttl=64 time=5.042 ms
64 bytes from 172.30.42.67: seq=1 ttl=64 time=98.623 ms
64 bytes from 172.30.42.67: seq=2 ttl=64 time=122.991 ms
64 bytes from 172.30.42.67: seq=3 ttl=64 time=1.346 ms
64 bytes from 172.30.42.67: seq=4 ttl=64 time=170.512 ms
64 bytes from 172.30.42.67: seq=5 ttl=64 time=194.345 ms
64 bytes from 172.30.42.67: seq=6 ttl=64 time=13.385 ms
64 bytes from 172.30.42.67: seq=7 ttl=64 time=37.313 ms
64 bytes from 172.30.42.67: seq=8 ttl=64 time=1.393 ms
64 bytes from 172.30.42.67: seq=9 ttl=64 time=84.963 ms
\^C
— 172.30.42.67 ping statistics —
10 packets transmitted, 10 packets received, 0% packet loss
round-trip min/avg/max = 1.346⁄72.991⁄194.345 ms
This is on an 802.11g (sw00) channel, since there seems to be an issue with DNS on the .11a (sw10) channel. Interestingly enough, when I associate with the .11a guest (sw11) channel, the DNS works. (Go figure; would you like me to file a bug report on that?)
Similarly, on my old MB:
root@Lirpo5:~# ping 172.30.42.87
PING 172.30.42.87 (172.30.42.87): 56 data bytes
64 bytes from 172.30.42.87: seq=0 ttl=64 time=1955.677 ms
64 bytes from 172.30.42.87: seq=1 ttl=64 time=955.671 ms
64 bytes from 172.30.42.87: seq=2 ttl=64 time=0.937 ms
64 bytes from 172.30.42.87: seq=3 ttl=64 time=0.978 ms
64 bytes from 172.30.42.87: seq=4 ttl=64 time=44.255 ms
64 bytes from 172.30.42.87: seq=5 ttl=64 time=68.310 ms
64 bytes from 172.30.42.87: seq=6 ttl=64 time=91.991 ms
64 bytes from 172.30.42.87: seq=7 ttl=64 time=13.431 ms
64 bytes from 172.30.42.87: seq=8 ttl=64 time=36.923 ms
64 bytes from 172.30.42.87: seq=9 ttl=64 time=61.483 ms
64 bytes from 172.30.42.87: seq=10 ttl=64 time=84.531 ms
\^C
— 172.30.42.87 ping statistics —
12 packets transmitted, 11 packets received, 8% packet loss
round-trip min/avg/max = 0.937⁄301.289⁄1955.677 ms
Next steps?
—————————————-
Bug #262: poor wireless performance in smoketest rc6
https://www.bufferbloat.net/issues/262
Author: Aidan Williams
Status: New
Priority: Normal
Assignee:
Category:
Target version:
Side by side comparison of Netgear and Cerowrt firmware shows that Cerowrt has significantly worse performance.
91Mbps Netgear 5 GHz
78Mbps Netgear 2.4 GHz
20Mbps Smoketest rc6 5 GHz
17Mbps Smoketest rc6 2.4 GHz
Images attached show signal levels and the output from the Optus Sydney speedtester which is quite local to my home network. The WiFi signal levels are comparable for both routers, so I don’t think this is an RF issue. There are some other APs in my area in the 2.4GHz band, but their levels are relatively low.
Notes:
* 2 x WNDR7200v2 boxes
* Netgear fw: 1.0.0.8
* Mac OSX 10.6.8, Macbook Pro laptop
* 3 feet between access points
* 4 feet to the laptop which was more or less equidistant to the APs
Similarly we had a problem at ccnx yesterday where ping and normal traceroute worked… but tcptraceroute and lft showed that (most likely) the nat table on the pix in use there was overflowing. The local guys were saying - look! ping works! and wandering all over the auditorium with their laptops thinking it was a wireless problem, pinging away perfectly, when few could form a tcp connection.
Now I note that while this mystery re: ping may be resolved (reporters, please test using andrew’s methods), we still have the bandwidth problems this bug started with, to deal with.
from openwrt…
———- Forwarded message ———-
From: Dave Taht dave.taht@gmail.com
Date: Sat, Sep 10, 2011 at 7:52 PM
Subject: Re: [Bismark-devel] fighting an osx bug with wireless
To: Stephen Woodrow srwoodrow@gmail.com
Cc: bismark-devel@projectbismark.net
Thx for checking this out. You pulled a new version of mac80211 from
openwrt or elsewhere?
The numbers you are getting from openwrt are significantly better than
the numbers anybody else are getting.
The >100Mbit numbers you are seeing from the netgear suggest HT40
mode
is in use on the factory firmware.
Do you have HT40 on, on your build? (this is not a good idea on 2.4
ghz, but might be on the 5ghz). We were doing even worse at HT40.
Secondly, the current factory firmware is a later version, which is
what the others are testing against. (I am not asking you test that)
On Sat, Sep 10, 2011 at 7:42 PM, Stephen Woodrow srwoodrow@gmail.com
wrote:
> Hi Dave,
>
> Srikanth and I did some unscientific testing using speedtest.net.
The
> test was run from a MacBook Pro to a wndr3700v2 placed one router
> length away, and with all other 802.11abgn sources nearby turned
off
> except for the gatech-provided wireless. The wndr was connected to
the
> gatech wired network and we tested to the atlanta/comcast
> speedtest.net measurement server.
>
> Srikanth notes that he pulled an updated version of mac80211 from
> August 26 as suggested by nbd.
>
> Here’s what we saw:
>
> openwrt r28087 (klatch-final) unencrypted / 5 GHz / channel 44:
> down: 87.87 (peaked at 90) Mbps
> up: 53.55 Mbps
>
> openwrt r28087 (klatch-final) / unencrypted / 2.4 GHz / channel 1:
> down: 71.68 Mbps
> up: 51.69 Mbps
>
> openwrt r28087 (klatch-final) / WPA2 PSK / 5 GHz / channel 44:
> down: 85.40 Mbps
> up: 53.24 Mbps
>
> openwrt r28087 (klatch-final) / WPA2 PSK / 2.4 GHz / channel 1:
> down: 61.78 Mbps
> up: 44.48 Mbps
>
> ————————————————-
>
> Netgear V1.0.0.6NA / unencrypted / 5 GHz / channel 44:
> down: 159.05 Mbps
> up: 61.56 Mbps
>
> Netgear V1.0.0.6NA / unencrypted / 2.4 GHz / channel 1:
> down: 74.84 Mbps
> up: 51.65 Mbps
>
> Netgear V1.0.0.6NA / WPA2 PSK / 5 GHz / channel 44:
> down: 138.49 (peaked at 140) Mbps
> up: 61.43 Mbps
>
> Netgear V1.0.0.6NA / WPA2 PSK / 2.4 GHz / channel 1:
> down: 65.04 Mbps
> up: 51.82 Mbps
>
> So there is no significant performance hit on 2.4 GHz but a
> significant hit on 5 GHz. Not to the degree that your tester
observed,
> but still significant (~45%). Hope you find this
interesting/helpful.
>
> –steve
>
> Man is that comforting! and confusing to the end user(s). If you can’t trust ping, what can you trust?
>
>(reporters, please test using andrew’s methods), we still have the bandwidth problems this bug started with, to deal with.
OK. Agreed about the confusing parts! Confirmatory evidence from here. I was seeing a similar ping scatter from my old stock OpenWRT router to the scatter observed on my wndr with rc6-smoketest6.
The traceroute -q 40 test showed the following response times:
root@Lirpo5:~# traceroute -q 40 172.30.42.67
traceroute to 172.30.42.67 (172.30.42.67), 30 hops max, 38 byte packets
1 dhcp-67.home.lan (172.30.42.67) 1.363 ms 3.018 ms 1.742 ms 1.371 ms
1.546 ms 1.158 ms 1.328 ms 1.338 ms 1.330 ms 2.004 ms 2.002 ms 1.383 ms
2.544 ms 2.076 ms 2.500 ms 1.471 ms 1.831 ms 0.984 ms 1.403 ms 1.685 ms
1.192 ms 1.186 ms 1.763 ms 1.369 ms 2.309 ms 3.192 ms 1.342 ms 1.299 ms
1.361 ms 1.321 ms 1.080 ms 1.687 ms 1.763 ms 1.675 ms 0.862 ms 1.618 ms
1.255 ms 1.177 ms 1.041 ms 0.956 ms
root@Lirpo5:~# traceroute -q 40 172.30.42.67
traceroute to 172.30.42.67 (172.30.42.67), 30 hops max, 38 byte packets
1 dhcp-67.home.lan (172.30.42.67) 1.742 ms 1.335 ms 2.059 ms 1.916 ms
1.427 ms 1.372 ms 1.368 ms 1.851 ms 1.387 ms 1.183 ms 1.254 ms 1.246 ms
1.330 ms 1.173 ms 1.330 ms 0.991 ms 1.239 ms 1.498 ms 1.156 ms 1.621 ms
1.551 ms 1.257 ms 3.467 ms 1.362 ms 1.413 ms 1.787 ms 1.562 ms 2.016 ms
1.268 ms 0.987 ms 1.415 ms 1.111 ms 1.276 ms 1.367 ms 5.009 ms 1.448 ms
1.370 ms 6.687 ms 1.138 ms 1.144 ms
These are clearly within the realm of sane values, modulo the odd 5 to 6+ms readings. (This is still on the moderately congested .11g channel, due to the DNS issue Dave opened a new bug for earlier.)
The netperf test came back with “Connection reset by peer” for both the TCP_RR and TCP_CRR variants. Since I am not a netperf expert, I’ll leave that to the gurus to interpret (firewall on OSX???)…
All of these tests were performed with network apps on the OSX box (such as Skype, mail.app, etc.) turned off.
Also, after some roundtrips to my local speedtest.net node, here in Perth, here is the output from the debug table requested by @Felix Fietkau a few days ago from my box:
cat /sys/kernel/debug/ieee80211/phy*/ath9k/xmit
Num-Tx-Queues: 10 tx-queues-setup: 0x10f poll-work-seen: 65673
BE BK VI VO
MPDUs Queued: 22634 0 17 5807
MPDUs Completed: 22625 0 17 3865
MPDUs XRetried: 9 0 0 1942
Aggregates: 1754 0 0 0
AMPDUs Queued HW: 76361 0 25 0
AMPDUs Queued SW: 9906 0 0 0
AMPDUs Completed: 86149 0 2 0
AMPDUs Retried: 2633 0 418 0
AMPDUs XRetried: 106 0 23 0
FIFO Underrun: 0 0 0 0
TXOP Exceeded: 0 0 0 0
TXTIMER Expiry: 0 0 0 0
DESC CFG Error: 0 0 0 0
DATA Underrun: 0 0 0 0
DELIM Underrun: 0 0 0 0
TX-Pkts-All: 108889 0 42 5807
TX-Bytes-All: 95378094 0 5073 988504
hw-put-tx-buf: 2 0 1 2
hw-tx-start: 103419 0 460 5807
hw-tx-proc-desc: 103419 0 460 5807
txq-memory-address: 832758e0 83275950 83275870 83275800
axq-qnum: 2 3 1 0
axq-depth: 0 0 0 0
axq-ampdu_depth: 0 0 0 0
axq-stopped 0 0 0 0
tx-in-progress 0 0 0 0
pending-frames 0 0 0 0
txq_headidx: 0 0 0 0
txq_tailidx: 0 0 0 0
axq_q empty: 0 1 0 0
axq_acq empty: 1 1 1 1
txq_fifo[0] empty: 1 1 1 1
txq_fifo[1] empty: 1 1 1 1
txq_fifo[2] empty: 1 1 1 1
txq_fifo[3] empty: 1 1 1 1
txq_fifo[4] empty: 1 1 1 1
txq_fifo[5] empty: 1 1 1 1
txq_fifo[6] empty: 1 1 1 1
txq_fifo[7] empty: 1 1 1 1
Num-Tx-Queues: 10 tx-queues-setup: 0x10f poll-work-seen: 65665
BE BK VI VO
MPDUs Queued: 21177 0 6 3222
MPDUs Completed: 21175 0 6 2689
MPDUs XRetried: 2 0 0 533
Aggregates: 4824 0 0 0
AMPDUs Queued HW: 91327 0 1 0
AMPDUs Queued SW: 15094 0 0 0
AMPDUs Completed: 106153 0 0 0
AMPDUs Retried: 3253 0 20 0
AMPDUs XRetried: 268 0 1 0
FIFO Underrun: 0 0 0 0
TXOP Exceeded: 0 0 0 0
TXTIMER Expiry: 0 0 0 0
DESC CFG Error: 0 0 0 0
DATA Underrun: 0 0 0 0
DELIM Underrun: 0 0 0 0
TX-Pkts-All: 127598 0 7 3222
TX-Bytes-All: 130959432 0 728 578192
hw-put-tx-buf: 2 0 1 2
hw-tx-start: 120875 0 27 3222
hw-tx-proc-desc: 120875 0 27 3222
txq-memory-address: 830ed8e0 830ed950 830ed870 830ed800
axq-qnum: 2 3 1 0
axq-depth: 0 0 0 0
axq-ampdu_depth: 0 0 0 0
axq-stopped 0 0 0 0
tx-in-progress 0 0 0 0
pending-frames 0 0 0 0
txq_headidx: 0 0 0 0
txq_tailidx: 0 0 0 0
axq_q empty: 0 1 0 0
axq_acq empty: 1 1 1 1
txq_fifo[0] empty: 1 1 1 1
txq_fifo[1] empty: 1 1 1 1
txq_fifo[2] empty: 1 1 1 1
txq_fifo[3] empty: 1 1 1 1
txq_fifo[4] empty: 1 1 1 1
txq_fifo[5] empty: 1 1 1 1
txq_fifo[6] empty: 1 1 1 1
txq_fifo[7] empty: 1 1 1 1
root@Lirpo5:~#
http://www.stuartcheshire.org/papers/NagleDelayedAck/
Don’t know the further implications for Cero. I hope this means the problem won’t simply be “written off” as Apple’s problem…
Also, of course, OS X Lion does not have the issue Stuart was writing about there (because he has long since fixed it, and I would expect there’s an automated validation test in place to make sure it stays fixed).
On 11/09/2011, at 6:31 PM, cerowrt@lists.bufferbloat.net wrote:
Issue #262 has been updated by Frank Horowitz.
Possibly further to OSX ping and other wireless networking issues:
http://www.stuartcheshire.org/papers/NagleDelayedAck/
Don’t know the further implications for Cero. I hope this means the problem won’t simply be “written off” as Apple’s problem…
—————————————-
Bug #262: poor wireless performance in smoketest rc6
https://www.bufferbloat.net/issues/262
Author: Aidan Williams
Status: New
Priority: Normal
Assignee:
Category:
Target version: 1st Public Cerowrt release
Side by side comparison of Netgear and Cerowrt firmware shows that Cerowrt has significantly worse performance.
91Mbps Netgear 5 GHz
78Mbps Netgear 2.4 GHz
20Mbps Smoketest rc6 5 GHz
17Mbps Smoketest rc6 2.4 GHz
Images attached show signal levels and the output from the Optus Sydney speedtester which is quite local to my home network. The WiFi signal levels are comparable for both routers, so I don’t think this is an RF issue. There are some other APs in my area in the 2.4GHz band, but their levels are relatively low.
Notes:
* 2 x WNDR7200v2 boxes
* Netgear fw: 1.0.0.8
* Mac OSX 10.6.8, Macbook Pro laptop
* 3 feet between access points
* 4 feet to the laptop which was more or less equidistant to the APs
However, on MacOSX, the Nagle algorithm can be disabled thusly:
sudo sysctl -w net.inet.tcp.delayed_ack=0
What about the VI column makes sense to you?
|AMPDUs Queued HW:        |76361          |0        |25         |0|
|AMPDUs Queued SW:         |9906          |0         |0         |0|
|AMPDUs Completed:        |86149          |0        | 2         |0|
|AMPDUs Retried:           |2633          |0       |418  (WTF?)  |     0|
|AMPDUs XRetried:           |106          |0        |23         |0|
Now to add a data point to this, I had added support to babel to set skb->priority to 0x105, which dumps stuff into the VI queue.
Babel does ipv6 multicast only. I had actually not intended to foist this patch off on others in this smoketest![]()! but it does raise interesting questions - is mac80211 handling multicast right in the general case (eg ipv6), what does happen when a packet is marked for a non-standard queue and is multicast. (there are multiple more normal ways for that to happen)
Is there any way to clearly see management frames entering the proper (VO?) queue, as well as multicast in general?
I will rip that patch out of babel for rc6-smoketest7. As babel issues packets on 4 second intervals I have difficulty believing it is a cause of this problem but the patch is arguably wrong anyway. But please don’t lose sight of the questions it raises.
smoketest7 is currently bottlenecked on bugs #266 and #265
This was put in place to clearly delineate each of the interface types so that someone like me could look at a random packet trace and say aha! 172.30.42.98 is the 5.x ghz network interface - which is impossible otherwise - and not have to think about problems happening elsewhere on the gige or other radio. Significantly more info about the Cerowrt Device naming scheme and Default network numbering are on the wiki.
Also it allows for a setup where we can setup a crypted link, an unencrypted link, and an adhoc link and test against those without having to reboot or reconfigure routers.
Also it reduces multicast/broadcast traffic considerably, while introducing new problems with dealing with things like multicast dns across devices - we have a mdnsresponder available for those folk that we hope will work.
Anyway, having a SSID and interface for the private, public, and ad-hoc wans - may also be introducing latencies and other difficulties like what we are seeing. It’s hard to rip out the extra interfaces, you have to pretty much manually edit /etc/config/wireless /etc/config/network and /etc/config/firewall and /etc/config/babel and /etc/babeld.conf to rip them out.
So overall, having just a general sense of the overhead of extra interfaces would be good. ?
Disable babel /etc/init.d/babeld stop, watch for multiple nameds (ps | grep named), rerun tests, get stats…
> A major difference between cerowrt and regular openwrt is that we support 3 interfaces per channel, and have 8 /27 subnets defined by default - and do not bridge AT ALL.
>
> This was put in place to clearly delineate each of the interface types so that someone like me could look at a random packet trace and say aha! 172.30.42.98 is the 5.x ghz network interface - which is impossible otherwise - and not have to think about problems happening elsewhere on the gige or other radio. Significantly more info about the Cerowrt Device naming scheme and Default network numbering are on the wiki.
>
> Also it allows for a setup where we can setup a crypted link, an unencrypted link, and an adhoc link and test against those without having to reboot or reconfigure routers.
>
> Also it reduces multicast/broadcast traffic considerably, while introducing new problems with dealing with things like multicast dns across devices - we have a mdnsresponder available for those folk that we hope will work.
>
> Anyway, having a SSID and interface for the private, public, and ad-hoc wans - may also be introducing latencies and other difficulties like what we are seeing. It’s hard to rip out the extra interfaces, you have to pretty much manually edit /etc/config/wireless /etc/config/network and /etc/config/firewall and /etc/config/babel and /etc/babeld.conf to rip them out.
>
> So overall, having just a general sense of the overhead of extra interfaces would be good. ?
Yes, it would be good to quantify, but I don’t think it’s the problem here.
On the smoketest I installed at home just before coming out here, I got 48-50Mbps from my ath9k laptop, pretty consistent with what you might expect with only a 20mhz channel (the iwconfig line said the interface was running at 130 bit rate).
On 12/09/2011, at 5:36 AM, cerowrt@lists.bufferbloat.net wrote:
Issue #262 has been updated by Jim Gettys.
Dave Täht wrote:
> A major difference between cerowrt and regular openwrt is that we support 3 interfaces per channel, and have 8 /27 subnets defined by default - and do not bridge AT ALL.
>
> This was put in place to clearly delineate each of the interface types so that someone like me could look at a random packet trace and say aha! 172.30.42.98 is the 5.x ghz network interface - which is impossible otherwise - and not have to think about problems happening elsewhere on the gige or other radio. Significantly more info about the Cerowrt Device naming scheme and Default network numbering are on the wiki.
>
> Also it allows for a setup where we can setup a crypted link, an unencrypted link, and an adhoc link and test against those without having to reboot or reconfigure routers.
>
> Also it reduces multicast/broadcast traffic considerably, while introducing new problems with dealing with things like multicast dns across devices - we have a mdnsresponder available for those folk that we hope will work.
>
> Anyway, having a SSID and interface for the private, public, and ad-hoc wans - may also be introducing latencies and other difficulties like what we are seeing. It’s hard to rip out the extra interfaces, you have to pretty much manually edit /etc/config/wireless /etc/config/network and /etc/config/firewall and /etc/config/babel and /etc/babeld.conf to rip them out.
>
> So overall, having just a general sense of the overhead of extra interfaces would be good. ?
Yes, it would be good to quantify, but I don’t think it’s the problem here.
On the smoketest I installed at home just before coming out here, I got 48-50Mbps from my ath9k laptop, pretty consistent with what you might expect with only a 20mhz channel (the iwconfig line said the interface was running at 130 bit rate).
—————————————-
Bug #262: poor wireless performance in smoketest rc6
https://www.bufferbloat.net/issues/262
Author: Aidan Williams
Status: New
Priority: Normal
Assignee:
Category:
Target version: 1st Public Cerowrt release
Side by side comparison of Netgear and Cerowrt firmware shows that Cerowrt has significantly worse performance.
91Mbps Netgear 5 GHz
78Mbps Netgear 2.4 GHz
20Mbps Smoketest rc6 5 GHz
17Mbps Smoketest rc6 2.4 GHz
Images attached show signal levels and the output from the Optus Sydney speedtester which is quite local to my home network. The WiFi signal levels are comparable for both routers, so I don’t think this is an RF issue. There are some other APs in my area in the 2.4GHz band, but their levels are relatively low.
Notes:
* 2 x WNDR7200v2 boxes
* Netgear fw: 1.0.0.8
* Mac OSX 10.6.8, Macbook Pro laptop
* 3 feet between access points
* 4 feet to the laptop which was more or less equidistant to the APs
Located 3 meters from the AP, with the 5ghz connection on channel 161 in HT40- mode, talking to my laptop (a lagn)
d@cruithne:~\$ netperf -l 120 -H gw.home.lan
MIGRATED TCP STREAM TEST from 0.0.0.0 (0.0.0.0) port 0 AF_INET to
gw.home.lan (172.30.42.33) port 0 AF_INET
Recv Send Send
Socket Socket Message Elapsed
Size Size Size Time Throughput
bytes bytes bytes secs. 10\^6bits/sec
87380 16384 16384 120.01 85.37
> What (unless something terrible happens) is rc6…
>
> Located 3 meters from the AP, with the 5ghz connection on channel 161 in HT40- mode, talking to my laptop (a lagn)
>
> d@cruithne:~\$ netperf -l 120 -H gw.home.lan
> MIGRATED TCP STREAM TEST from 0.0.0.0 (0.0.0.0) port 0 AF_INET to gw.home.lan (172.30.42.33) port 0 AF_INET
> Recv Send Send
> Socket Socket Message Elapsed
> Size Size Size Time Throughput
> bytes bytes bytes secs. 10\^6bits/sec
>
> 87380 16384 16384 120.01 85.37
Ok, this is more respectable. I’ll try to get some release notes done today from what we had on the white board.
Per our discussion, it sounded like CeroWrt should not default to ht40 on 2.4 ghz and should on 5ghz, or that seemed to be your opinion, anyway, IIRC.
> What (unless something terrible happens) is rc6…
I installed this:
http://huchra.bufferbloat.net/~cero1/cerowrt-wndr3700-1.0rc6/openwrt-ar71xx-generic-wndr3700v2-jffs2-sysupgrade.bin
Things have improved a lot…
Same test as at the beginning of this thread gives:
88Mbps Netgear 5 GHz
76Mbps Netgear 2.4 GHz
78Mbps rc6 5 GHz
67Mbps rc6 2.4 GHz
Is there an email list for monitoring checkins? I looked on lists.bufferbloat.net/listinfo, but the “commit” lists seem unused or inactive…
New results from the debug tables:
root@Lirpo5:~# cat /sys/kernel/debug/ieee80211/phy*/ath9k/xmit
Num-Tx-Queues: 10  tx-queues-setup: 0x10f poll-work-seen: 559
                            BE         BK        VI        VO

MPDUs Queued:              172          0         0       759
MPDUs Completed:           172          0         0       673
MPDUs XRetried:              0          0         0        86
Aggregates:                  0          0         0         0
AMPDUs Queued HW:            0          0         0         0
AMPDUs Queued SW:            0          0         0         0
AMPDUs Completed:            0          0         0         0
AMPDUs Retried:              0          0         0         0
AMPDUs XRetried:             0          0         0         0
FIFO Underrun:               0          0         0         0
TXOP Exceeded:               0          0         0         0
TXTIMER Expiry:              0          0         0         0
DESC CFG Error:              0          0         0         0
DATA Underrun:               0          0         0         0
DELIM Underrun:              0          0         0         0
TX-Pkts-All:               172          0         0       759
TX-Bytes-All:            17380          0         0    132591
hw-put-tx-buf:               2          0         0         2
hw-tx-start:               172          0         0       759
hw-tx-proc-desc:           172          0         0       759
txq-memory-address:   831cd8e0   831cd950  831cd870  831cd800
axq-qnum:                    2          3         1         0
axq-depth:                   0          0         0         0
axq-ampdu_depth:             0          0         0         0
axq-stopped                  0          0         0         0
tx-in-progress               0          0         0         0
pending-frames               0          0         0         0
txq_headidx:                 0          0         0         0
txq_tailidx:                 0          0         0         0
axq_q empty:                   0          1         1         0
axq_acq empty:                 1          1         1         1
txq_fifo[0] empty:             1          1         1         1
txq_fifo[1] empty:             1          1         1         1
txq_fifo[2] empty:             1          1         1         1
txq_fifo[3] empty:             1          1         1         1
txq_fifo[4] empty:             1          1         1         1
txq_fifo[5] empty:             1          1         1         1
txq_fifo[6] empty:             1          1         1         1
txq_fifo[7] empty:             1          1         1         1
Num-Tx-Queues: 10  tx-queues-setup: 0x10f poll-work-seen: 550
                            BE         BK        VI        VO

MPDUs Queued:              443          0         1       140
MPDUs Completed:           443          0         1       135
MPDUs XRetried:              0          0         0         5
Aggregates:                 59          0         0         0
AMPDUs Queued HW:        18658          0         0         0
AMPDUs Queued SW:          261          0         0         0
AMPDUs Completed:        18918          0         0         0
AMPDUs Retried:             19          0         0         0
AMPDUs XRetried:             0          0         0         0
FIFO Underrun:               0          0         0         0
TXOP Exceeded:               0          0         0         0
TXTIMER Expiry:              0          0         0         0
DESC CFG Error:              0          0         0         0
DATA Underrun:               0          0         0         0
DELIM Underrun:              0          0         0         0
TX-Pkts-All:             19362          0         1       140
TX-Bytes-All:         24463657          0       104     22277
hw-put-tx-buf:               2          0         1         2
hw-tx-start:             19229          0         1       140
hw-tx-proc-desc:         19229          0         1       140
txq-memory-address:   831258e0   83125950  83125870  83125800
axq-qnum:                    2          3         1         0
axq-depth:                   0          0         0         0
axq-ampdu_depth:             0          0         0         0
axq-stopped                  0          0         0         0
tx-in-progress               0          0         0         0
pending-frames               0          0         0         0
txq_headidx:                 0          0         0         0
txq_tailidx:                 0          0         0         0
axq_q empty:                   0          1         0         0
axq_acq empty:                 1          1         1         1
txq_fifo[0] empty:             1          1         1         1
txq_fifo[1] empty:             1          1         1         1
txq_fifo[2] empty:             1          1         1         1
txq_fifo[3] empty:             1          1         1         1
txq_fifo[4] empty:             1          1         1         1
txq_fifo[5] empty:             1          1         1         1
txq_fifo[6] empty:             1          1         1         1
txq_fifo[7] empty:             1          1         1         1
root@Lirpo5:~#
So far, so good.
cat /sys/kernel/debug/ieee80211/phy*/ath9k/xmit
Num-Tx-Queues: 10  tx-queues-setup: 0x10f poll-work-seen: 1577
                            BE         BK        VI        VO

MPDUs Queued:              664          0         5      2197
MPDUs Completed:           664          0         5      1927
MPDUs XRetried:              0          0         0       270
Aggregates:                  6          0         0         0
AMPDUs Queued HW:          289          0         6         0
AMPDUs Queued SW:           37          0         0         0
AMPDUs Completed:          321          0         0         0
AMPDUs Retried:             96          0       117         0
AMPDUs XRetried:             5          0         6         0
FIFO Underrun:               0          0         0         0
TXOP Exceeded:               0          0         0         0
TXTIMER Expiry:              0          0         0         0
DESC CFG Error:              0          0         0         0
DATA Underrun:               0          0         0         0
DELIM Underrun:              0          0         0         0
TX-Pkts-All:               990          0        11      2197
TX-Bytes-All:           166749          0      1176    380758
hw-put-tx-buf:               2          0         1         2
hw-tx-start:              1063          0       128      2197
hw-tx-proc-desc:          1063          0       128      2197
txq-memory-address:   831cd8e0   831cd950  831cd870  831cd800
axq-qnum:                    2          3         1         0
axq-depth:                   0          0         0         0
axq-ampdu_depth:             0          0         0         0
axq-stopped                  0          0         0         0
tx-in-progress               0          0         0         0
pending-frames               0          0         0         0
txq_headidx:                 0          0         0         0
txq_tailidx:                 0          0         0         0
axq_q empty:                   0          1         0         0
axq_acq empty:                 1          1         1         1
txq_fifo[0] empty:             1          1         1         1
txq_fifo[1] empty:             1          1         1         1
txq_fifo[2] empty:             1          1         1         1
txq_fifo[3] empty:             1          1         1         1
txq_fifo[4] empty:             1          1         1         1
txq_fifo[5] empty:             1          1         1         1
txq_fifo[6] empty:             1          1         1         1
txq_fifo[7] empty:             1          1         1         1
Num-Tx-Queues: 10  tx-queues-setup: 0x10f poll-work-seen: 1567
                            BE         BK        VI        VO

MPDUs Queued:             1232          0         9       822
MPDUs Completed:          1232          0         7       505
MPDUs XRetried:              0          0         2       317
Aggregates:                197          0         0         0
AMPDUs Queued HW:        20285          0         7         0
AMPDUs Queued SW:          583          0         0         0
AMPDUs Completed:        20726          0         1         0
AMPDUs Retried:            615          0        96         0
AMPDUs XRetried:           141          0         6         0
FIFO Underrun:               0          0         0         0
TXOP Exceeded:               0          0         0         0
TXTIMER Expiry:              0          0         0         0
DESC CFG Error:              0          0         0         0
DATA Underrun:               0          0         0         0
DELIM Underrun:              0          0         0         0
TX-Pkts-All:             22099          0        16       822
TX-Bytes-All:         25205356          0      1728    106703
hw-put-tx-buf:               2          0         1         2
hw-tx-start:             22182          0       112       822
hw-tx-proc-desc:         22181          0       112       822
txq-memory-address:   831258e0   83125950  83125870  83125800
axq-qnum:                    2          3         1         0
axq-depth:                   1          0         0         0
axq-ampdu_depth:             1          0         0         0
axq-stopped                  0          0         0         0
tx-in-progress               0          0         0         0
pending-frames               0          0         0         0
txq_headidx:                 0          0         0         0
txq_tailidx:                 0          0         0         0
axq_q empty:                   0          1         0         0
axq_acq empty:                 1          1         1         1
txq_fifo[0] empty:             1          1         1         1
txq_fifo[1] empty:             1          1         1         1
txq_fifo[2] empty:             1          1         1         1
txq_fifo[3] empty:             1          1         1         1
txq_fifo[4] empty:             1          1         1         1
txq_fifo[5] empty:             1          1         1         1
txq_fifo[6] empty:             1          1         1         1
txq_fifo[7] empty:             1          1         1         1
(Edited to add:) Just to clarify, this is on a MB Pro, under OSX Lion, using (mostly) the 802.11an/sw10 radio. I have set the Country Code to AU to match my location, left the .11bgn bandwidth to 20MHz, and set the .11an bandwidth to 40Mhz in my adjustments to the stock config. Also, just in case it matters, I’ve set WPA-PSK on the sw00 interface (to work around a bug in my Android phone’s wireles), WPA/WPA2-PSK mixed mode on the gw00 and gw10 interfaces, and WPA2-PSK on the sw10 interface. Just in case any of that triggers an “aha” in one of you guru’s head ;-)
We can find ways to do gnarly things to streams however to beat up on
the VI queue code, using iptables, to exercise this problem more,
using for example, iperf, which sits on ports 5000-5002
For example, for raw ethernet performance, (see #269 ) I can get 440Mbit/sec out of txqueuelen 64 on the router to another host going out interface ge00 on the same switch at gigE. txqueuelen of 8 - as currently set to - I get ~200Mbit. If I up the device driver buffers slightly I can get 530Mbit (which, btw, is better than the factory firmware can achieve) to another device on the same switch.
Not that this is the right thing for an uplink that is running at speeds far lower than that, NOR is it the right thing for stuff going out longer distances and paths, as calculated by BDP - and a pure BDP calculation doesn’t account for interrupt overhead, queueling overhead, or other buffering going on in the kernel such as that on the recieve path. ALSO: I got very interesting results by upping the maximum TCP window size via sysctl as per #269 for iperf testing, both on the router itself (when driving the tests) and on the laptop (driving the tests through the router to the lab)
Similarly, txqueuelen of 37 on the various wireless interfaces is about the right compromise for single streams running at ~60Mbit, as seen in testing so far. I wouldn’t mind if - now that we can regularly crack 60Mbit on wireless, we tried higher values for txqueuelen on wireless interfaces so long as the testers understand that they are compromising latency and wireless-g performance by doing so - AND we move towards testing multiple streams with various tools.
The place to fiddle with txqueuelen is /etc/hotplug.d/iface/00-debloat
Thx everybody for playing with this stuff. Understanding how the current kernel responds to tweaking is very important to coming up with dynamic algorithms that do more of the right thing. I will try to make the various test boxes at bloatlab 1 more accessible to all soon, with more tests….
(07:28:32 AM) nbd: latest might work better

(07:29:06 AM) dtaht99: how latest? :) I have some positive reports on
what became rc6, which was from 2? 3 days back.

(07:29:13 AM) dtaht99: the VI queue weirdness bothers me a lot

(07:29:42 AM) dtaht99: http://www.bufferbloat.net/issues/262#note-44
(07:30:08 AM) nbd: i fixed some potential encryption related bugs today

(07:30:14 AM) nbd: what’s weird about the VI queue?

(07:30:39 AM) dtaht99: AMPDUs Completed: 321 0 0 0 AMPDUs Retried: 96 0
117 0 AMPDUs XRetried: 5 0 6 0

(07:30:41 AM) dtaht99: meh

(07:30:51 AM) nbd: so?

(07:30:59 AM) dtaht99: see completed, queued, retried in the vi queue in
the above bug note

(07:31:21 AM) dtaht99: why 0 completed, and 117 retried?

(07:31:32 AM) dtaht99: and 6 queued

(07:31:32 AM) nbd: oh, right

(07:31:34 AM) nbd: that’s weird

(07:31:37 AM) dtaht99: very

(07:31:56 AM) dtaht99: could be as simple as the logging routine sending
stuff to the wrong place

(07:32:01 AM) nbd: yeah

(07:32:03 AM) dtaht99: but I doubt it.

(07:32:05 AM) nbd: i’ll take a look at the logging stuff

(07:32:15 AM) dtaht99: the problem is

(07:32:45 AM) dtaht99: http://www.bufferbloat.net/issues/262#note-43
(07:33:07 AM) dtaht99: statistically, the odds of getting the VI queue
thing happening should have happened by note-43, if it were merely a
logging bug.

(07:34:55 AM) dtaht99: also, you’d asked me for good values for
txqueuelen, and that’s a hard question

(07:35:06 AM) dtaht99: answer #1 - 1000 is the wrong answer. :)

(07:35:24 AM) dtaht99: answer #2 - it really has to be dynamic in the
long run

(07:36:03 AM) nbd: ok, it’s not a logging bug

(07:36:04 AM) dtaht99: answer #3 - pretty good range of results as
noted in this bug and bug 269 - but this is all the results of single
stream tests

(07:36:07 AM) nbd: and the output makes some sense

(07:36:15 AM) *****dtaht99 awaits enlightenment

(07:36:17 AM) nbd: xretried mpdus are not reported as completed

(07:36:28 AM) nbd: well, it’s partially a logging bug

(07:36:36 AM) nbd: each sw retransmit attempt counts

(07:37:43 AM) nbd: i should add logging for reporting how often frames
are filtered

(07:37:55 AM) dtaht99: AMPDUs Retried: is a retry of an entire ampdu or
just the failed packets?

(07:38:13 AM) dtaht99: I mean, 6 queued in hardware, and 117 retried
doesn’t make a whole lot of sense

(07:38:24 AM) nbd: just failed subframe

(07:38:36 AM) dtaht99: that’s a lot of failures in that ratio

(07:38:44 AM) nbd: yes

(07:38:49 AM) nbd: could be powersave related crap

(07:38:49 AM) nbd: not sure

(07:39:08 AM) dtaht99: possible the length of the VI queue needs to be
shorter for ampdu calculations?

(07:39:33 AM) dtaht99: I was under the impression the size of that
transmission window was MUCH smaller than BE

(07:40:21 AM) nbd: length of the VI queue? what does that have to do
with this?

(07:40:35 AM) dtaht99: how many packets can be aggregated in the VI
queue

(07:40:41 AM) dtaht99: vs the BE queue

(07:41:19 AM) *****dtaht99 freely admits to being stupid about how
these variables interrelate

(07:41:53 AM) dtaht99: http://en.wikipedia.org/wiki/IEEE_802.11e-2005
(07:42:04 AM) dtaht99: Video (AC_VI) 15 31 2 3.008ms

(07:42:22 AM) dtaht99: meh, was trying to paste from the edca table in
that wikipedia entry

(07:42:59 AM) dtaht99: max txop of 3.008 ms for VI

(07:44:08 AM) dtaht99: (that also said, I have no idea what is sending
packets into the VI queue in the first place at present. best way to
exercise this code is to toss some iptables rules in to exercise that
queue with some test tool)

(07:44:14 AM) dtaht99: (and I note I’m packing for france

(07:45:07 AM) nbd: i think it uses the same 4ms limit for all queues

(07:45:09 AM) dtaht99: as you are packing for america) and I gotta run
shortly. just wanted to get a snapshot of your status…

(07:45:13 AM) dtaht99: hmmm…

(07:45:50 AM) dtaht99: a little exercise is called for, methinks. But I
lack time and my hardware is packed away (actually, given to esr)

(07:45:55 AM) dtaht99: no worries

(07:45:59 AM) dtaht99: catch ya later
the new qfq qdisc hangs the ethernet interface (at least in my testing
thus far, and it’s not a default, just something new I wanted to try).
Maybe I’ve just configured it wrong….
Aside from that, it seems happy. I am off to test the VI queue + ipv6
next…
It DID occur to me that txqueuelen 40 made no sense on adhoc interfaces
that can’t aggregate, so I’ll fix that next time. Or hope aggregation
makes it to adhoc
1) txqueuelen 1000 on the laptop (connected 8 cm from the AP)
d@cruithne:~/org\$ netperf -l 60 -H 172.30.42.97
MIGRATED TCP STREAM TEST from 0.0.0.0 (0.0.0.0) port 0 AF_INET to
172.30.42.97 (172.30.42.97) port 0 AF_INET
Recv Send Send
Socket Socket Message Elapsed
Size Size Size Time Throughput
bytes bytes bytes secs. 10\^6bits/sec
87380 65536 65536 60.17 46.17
Weirdness here: 3.1.0-rc4-dbt23
Intel Corporation PRO/Wireless 5100 AGN
wlan0 IEEE 802.11abgn ESSID:“CEROwrt5”
Mode:Managed Frequency:5.18 GHz Access Point:
A0:21:B7:B0:56:67
Bit Rate=150 Mb/s Tx-Power=15 dBm
Retry long limit:7 RTS thr:off Fragment thr:off
Power Management:off
Link Quality=70⁄70 Signal level=-25 dBm
Rx invalid nwid:0 Rx invalid crypt:0 Rx invalid frag:0
Tx excessive retries:457611 Invalid misc:451 Missed beacon:0
^^ WTF?
pings range from 120 ms to 420+ ms
2) txqueuelen 50 on laptop
MIGRATED TCP STREAM TEST from 0.0.0.0 (0.0.0.0) port 0 AF_INET to
172.30.42.97 (172.30.42.97) port 0 AF_INET
Recv Send Send
Socket Socket Message Elapsed
Size Size Size Time Throughput
bytes bytes bytes secs. 10\^6bits/sec
87380 65536 65536 60.18 45.93
pings in the range 7-14 ms, with a few outliers
On 10/29/2011 09:35 PM, David Täht wrote:
> Dear Jim: (and our more enthusiastic folk cc’d)
>
> rc7-smoketest7 is up in the usual place. TOTALLY UNTESTED (and
thus,
> this private msg - I will test on monday if nobody beats me to it),
so
> read on…
>
> http://huchra.bufferbloat.net/~cero1/rc7-smoketests/
>
> And now that I have sites in france and california set up I would
like
> to nail this bug to the wall!
>
> http://www.bufferbloat.net/issues/262
>
> Not just performance, but notably the weirdness with VI - AND also
get
> reasonable single and multi-stream throughput on a variety of
scenarios.
>
> I’m looking forward to burning my 3800 when I get back to paris…
and
> I intend to be nose to the grindstone all month… if anyone has
> suggestions on what ELSE I should focus on? (High on my list also
is
> vpn testing)
>
> I was (and remain) very happy with the responsiveness of the
previous
> smoketests in most respects.
> (see attached plot). Factor of 5 improvement overall… not bad.
>
> In the long run we need to have a per-device txqueue for wireless,
at
> least as g still sucks rocks. I keep poking into it - too many
> layers.
>
> However jg did manage to prove to me that a mildly longer
txqueuelen
> helps on con-us distances on
> ethernet. (do you still have that data?) Not that that’s the case
> EITHER for inside the home or for most web accesses - but I have
no
> way to control the txqueuelen for the ‘internal’ interface vs the
> external interface at present. Also I had weirdness with
txqueuelen
> 37 (see bug #288) and dup pings that I could not duplicate with
> txqueuelen 40.
>
> so… for rc7-smoketest7 and later…
>
> I have reset the cerowrt defaults to be ‘40’ txqueuelen - which +
> driver bufs (currently 4) is something between 50 (what 9/10th the
> theorists use) and 1⁄3 100 (33) (what we suspect is closer to ‘mo
> right’).
> I suspect I’ll need driver tx bufs of 8, actually - or to increase
the
> clock interrupt.
>
> I updated to babeld from git head, which had a CS6 patch in it,
too.
> This will probably annoy julius.
> (it’s a SMOKETEST julius)
>
> I’ve also (I hope) fixed ipv6 diffserv handling over wireless - or
> broke wireless completely (maybe) - with this smoketest. Feel free
to
> NOT try rc7-smoketest7 - as I won’t be installing it myself until
I
> get to back to paris late tomorrow or monday. Have you tried your
> 3800s yet? :)
>
> I have also added QFQ support, which looks promising. Although a
quick
> test on a live interface hung the box![]() I’d want to add this to
all
> the ethernet interfaces by default, after it works.
>
> pfifo_fast must die!
>
> And am back to hacking on the switch for real W-FQ support….
>
> And planning on having the qos scripts set the txqueuelen when
handed
> a bandwidth figure.
>
> And will be doing another round of testing starting tuesday or so.
>
> I was very impressed by john linville’s presentation at linuxcon -
and
> he had a full room for it, too.
>
Cerowrt Project
Recent Updates
Find us elsewhere
#bufferbloat on Twitter
Google+ group
Archived Bufferbloat pages from the Wayback Machine
Sponsors
Comcast Research Innovation FundNlnet Foundation
Shuttleworth Foundation
GoFundMe
Bufferbloat Related Projects
OpenWrt ProjectCongestion Control Blog
Flent Network Test Suite
Sqm-Scripts
The Cake shaper
AQMs in BSD
IETF AQM WG
CeroWrt (where it all started)
Network Performance Related Resources
Jim Gettys' Blog - The chairman of the Fjord
Toke's Blog - Karlstad University's work on bloat
Voip Users Conference - Weekly Videoconference mostly about voip
Candelatech - A wifi testing company that "gets it".